June 2026 Merritt Island Real Estate Market Report
A data-driven look at North Merritt Island and South Merritt Island housing trends, including home prices, inventory, days on market, price reductions, luxury sales, and what today’s market means for buyers and sellers.
By Bobby Freeman, REALTOR® | McCoy Freeman Group at Compass
Published June 20, 2026 · Data Source: Stellar MLS · Data Window: January 1 – June 19, 2026 · ZIP Codes: 32953 and 32952

Executive Summary
The June 2026 Merritt Island housing market is one of the more balanced markets on the Space Coast. North Merritt Island and South Merritt Island are both carrying roughly five to five and a half months of inventory, which places the island close to balanced-market conditions rather than clearly favoring either buyers or sellers.
That said, balance does not mean every home performs the same. Well-priced homes are still moving quickly, while nearly half of active listings have taken price reductions. South Merritt Island carries the stronger luxury and waterfront tier, while North Merritt Island is moving faster overall and offers broader inventory across more price points.
“Merritt Island is not frozen. The market is balanced, but buyers are rewarding accurate pricing and punishing overpricing.”
— Bobby Freeman
What Stands Out
What surprised me most about the Merritt Island market.
The most surprising statistic is not inventory or pricing. It is how quickly properly priced homes are still selling.
Nearly 29% of closed sales in both North and South Merritt Island went under contract in 14 days or less. That tells me buyers are still active. They are simply more selective than they were during the faster pandemic-era market.
Homes that launch at realistic prices are still attracting strong interest. Homes that overshoot the market are often joining the nearly 50% of listings that eventually reduce their asking price.
North Merritt
North Merritt Island is balanced and moving faster.
North Merritt Island, ZIP code 32953, recorded 198 closed sales through June 19, 2026. This is the larger, faster-moving half of the island, with a broad mix of entry-level, move-up, acreage, and waterfront homes.
| Metric | Value |
|---|---|
| Total MLS Rows | 428 |
| Active Listings | 200 |
| Pending Sales | 24 |
| Sold / Closed YTD | 198 |
| Median Sold Price | $525,000 |
| Active Median List Price | $425,000 |
| Median Sold Price / Sq Ft | $234 |
| Active Median Price / Sq Ft | $232 |
| Median Days on Market | 38 days |
| Quick-Sale Rate ≤14 Days | 28.8% |
| Median List-to-Sale Ratio | 97.7% |
| Sold At or Over Asking Price | 24 of 198 | 12.1% |
| Listings with Price Reductions | 48.4% |
| Average Price Reduction | 7.3% |
| Months of Inventory | 5.6 months |
North Merritt Island Sold Homes by Price Range
Under $300K
$300K–$500K
$500K–$750K
$750K–$1M
$1M–$1.5M
$1.5M+
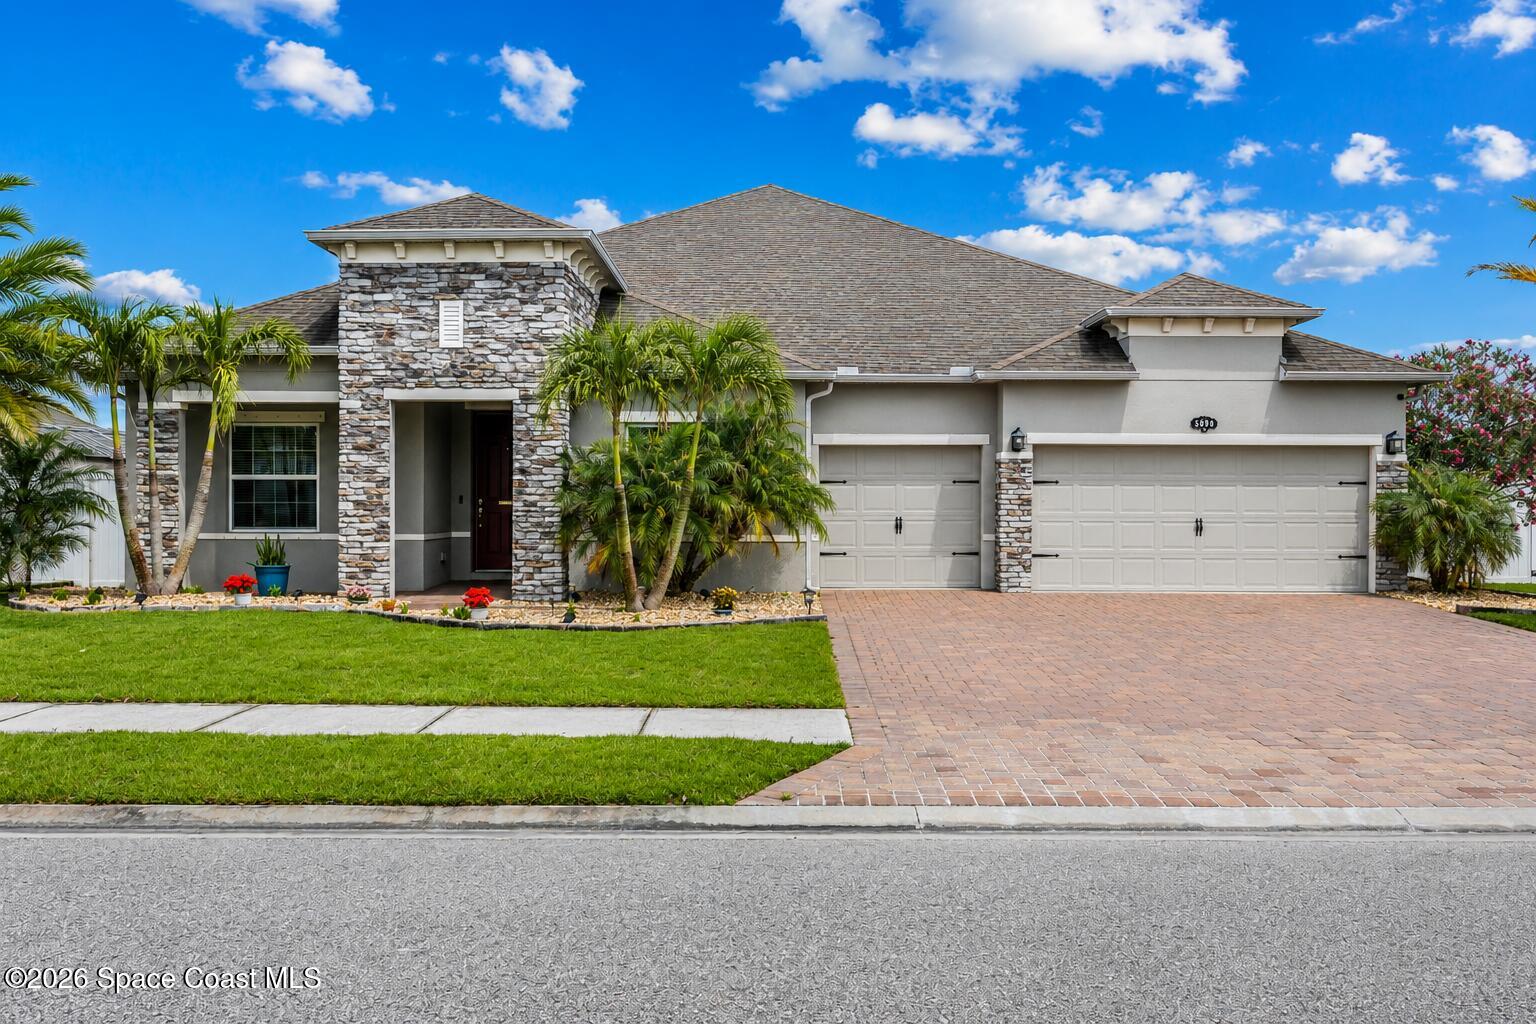
Recent Merritt Island home represented by Bobby Freeman and McCoy Freeman Group.
This is the most balanced corner of Merritt Island right now. Just under half of listings have taken a price cut, but the typical home is still selling close to list price and in about five and a half weeks. Accurate pricing on day one keeps sellers out of the markdown pile, while buyers should be ready to move quickly in the $500K to $750K range.
South Merritt
South Merritt Island carries the deeper luxury and waterfront market.
South Merritt Island, ZIP code 32952, recorded 135 closed sales through June 19, 2026. This half of the island carries higher price points, more luxury inventory, and many of Merritt Island’s most desirable waterfront opportunities.
| Metric | Value |
|---|---|
| Total MLS Rows | 283 |
| Active Listings | 125 |
| Pending Sales | 15 |
| Sold / Closed YTD | 135 |
| Median Sold Price | $535,000 |
| Active Median List Price | $629,000 |
| Median Sold Price / Sq Ft | $252 |
| Active Median Price / Sq Ft | $280 |
| Median Days on Market | 53 days |
| Quick-Sale Rate ≤14 Days | 28.1% |
| Median List-to-Sale Ratio | 97.4% |
| Sold At or Over Asking Price | 10 of 135 | 7.4% |
| Listings with Price Reductions | 48.8% |
| Average Price Reduction | 8.6% |
| Months of Inventory | 5.1 months |
South Merritt Island Sold Homes by Price Range
Under $300K
$300K–$500K
$500K–$750K
$750K–$1M
$1M–$1.5M
$1.5M+
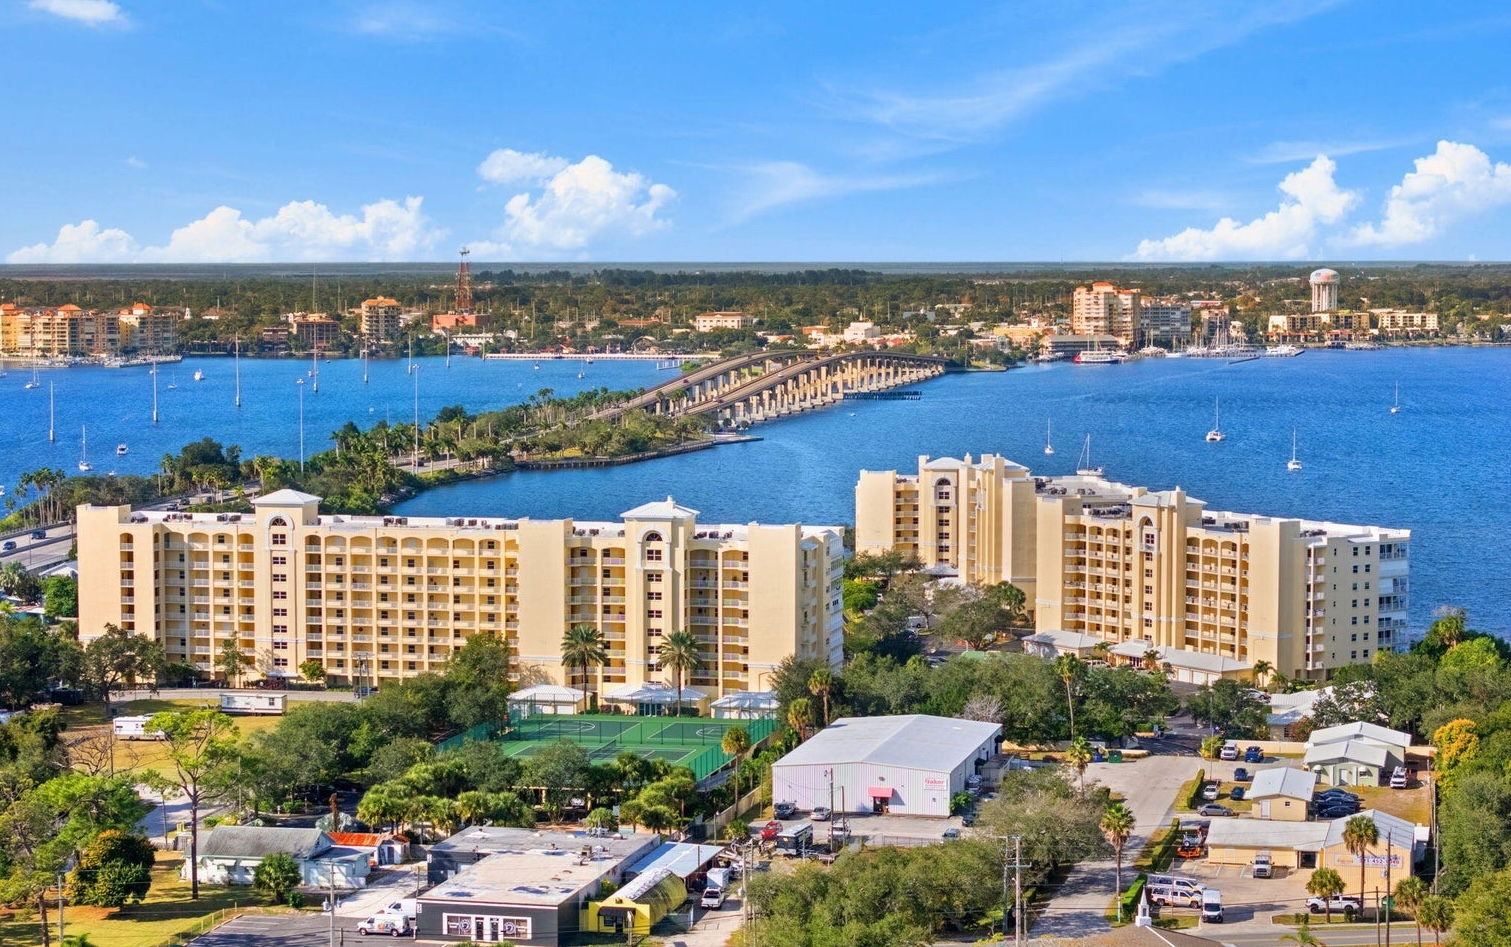
Waterfront living remains one of the strongest segments of the South Merritt Island market.
This is where Merritt Island’s luxury and waterfront activity lives. Nineteen homes have already closed above $1 million this year, nearly double North Merritt Island’s count. Homes here take longer to sell, so precise, comparable-driven pricing matters even more. Buyers shopping above $750K have real selection and some room to negotiate.
South Merritt Island leads the island’s luxury market.
Through June 2026, nineteen South Merritt Island properties closed above $1 million compared to ten in North Merritt Island. Demand remains strongest for deep-water canal homes, Indian River waterfront properties, estate-sized lots, updated luxury homes, and homes with boating access.
Local Factors
Why Merritt Island remains one of the Space Coast’s most desirable communities.
Merritt Island occupies a unique position in the Brevard County housing market. Residents enjoy larger lots, waterfront opportunities, boating access, proximity to Kennedy Space Center, quick access to Cocoa Beach, Port Canaveral, and Viera, while maintaining a quieter residential environment than many coastal communities.
Those lifestyle advantages continue to support long-term demand even as inventory levels have normalized. For sellers, that means location still matters. For buyers, it means the best properties are not always the cheapest properties — they are the ones that combine condition, location, lifestyle, and long-term value.
Seller Strategy
For Merritt Island sellers, pricing discipline is the difference-maker.
With close to half of listings taking a price reduction, coming in priced at market from day one is what keeps your home out of the markdown pile. List-to-sale ratios above 97% in both areas tell us buyers are still paying close to asking when the price is right.
The key numbers to know before you list are your price per square foot versus the current median for your half of the island, how your home compares to recent closed sales nearby, and whether you are in the faster-moving North Merritt Island band or the higher-priced South Merritt Island band.
Related seller resources: Space Coast Home Selling Strategy, Why Your Space Coast Home Isn’t Selling, and What Adds Value to a Waterfront Home.
Buyer Strategy
Buyers have options, but the best Merritt Island homes still move.
Merritt Island is more balanced than some neighboring Space Coast markets, but that does not mean there is no room to negotiate. Roughly half of active listings have already had a price cut, and homes sitting past 45 to 60 days are worth a closer look.
North Merritt Island offers the deepest inventory in the $300K to $750K range, while South Merritt Island is where buyers will find the bulk of the island’s $1M-plus and waterfront options.
Useful buyer resources: Space Coast Home Buyer Resources, Merritt Island Real Estate Guide, and McCoy Freeman Group Record-Setting Sales.
North Merritt Island vs. South Merritt Island: Quick Comparison
| Metric | North Merritt Island | South Merritt Island |
|---|---|---|
| Median Sold Price | $525,000 | $535,000 |
| Median Days on Market | 38 days | 53 days |
| Months of Inventory | 5.6 | 5.1 |
| Quick-Sale Rate | 28.8% | 28.1% |
| Listings with Price Cuts | 48.4% | 48.8% |
| $1M+ Closed Sales YTD | 10 | 19 |
| Sold Price / Sq Ft | $234 | $252 |
| Market Character | Broader inventory, faster pace | Higher price tier, deeper luxury pool |
What is your Merritt Island home worth in this market?
I’ll compare your home against active listings, pending sales, recent closings, price reductions, waterfront premiums, and buyer behavior in your exact segment.
About
Local market insight from Bobby and Nikki Freeman.

Bobby Freeman and Nikki McCoy Freeman lead McCoy Freeman Group at Compass, specializing in Merritt Island, Cocoa Beach, Cape Canaveral, waterfront homes, luxury properties, and Space Coast real estate. Their work combines local knowledge, property-specific pricing, high-end marketing, and practical guidance for buyers and sellers navigating a more selective market.
Learn more about Bobby Freeman, Nikki McCoy Freeman, and the McCoy Freeman Group record-setting sales.
FAQs
Frequently Asked Questions
Is Merritt Island a buyer’s market or seller’s market in June 2026?
Merritt Island is one of the more balanced markets on the Space Coast in mid-2026. North Merritt Island has 5.6 months of inventory and South Merritt Island has 5.1 months of inventory, placing both areas near balanced-market conditions.
What is the median home price in North Merritt Island?
The median sold price in North Merritt Island, ZIP code 32953, through June 19, 2026 is $525,000.
What is the median home price in South Merritt Island?
The median sold price in South Merritt Island, ZIP code 32952, through June 19, 2026 is $535,000.
How long does it take to sell a home on Merritt Island?
The median days on market is 38 days in North Merritt Island and 53 days in South Merritt Island. Correctly priced homes can move much faster, with nearly 29% of sales in both areas closing within 14 days.
Are luxury buyers still active on Merritt Island?
Yes. Through June 19, 2026, South Merritt Island recorded 19 closed sales above $1 million, while North Merritt Island recorded 10 closed sales above $1 million.
What is my Merritt Island home worth?
Your value depends on your property type, condition, lot size, waterfront access, view, updates, location, and current competition. A property-specific comparative market analysis is the best way to determine real market value.
Methodology & Data Notes: Source: Stellar MLS exports for ZIP codes 32953 and 32952. Data window: January 1 – June 19, 2026. Price reductions were calculated as the original list price minus the list price where the reduction was greater than 1%. List-to-sale ratio and sold at/over asking were calculated against the most recent list price, not the original list price. Months of inventory equals active listing count divided by closed count per month in the data window. Medians were calculated in Python via pandas.
This report is for informational purposes only and does not constitute legal, financial, or investment advice. Data reflects MLS-reported figures and may differ from third-party aggregators.